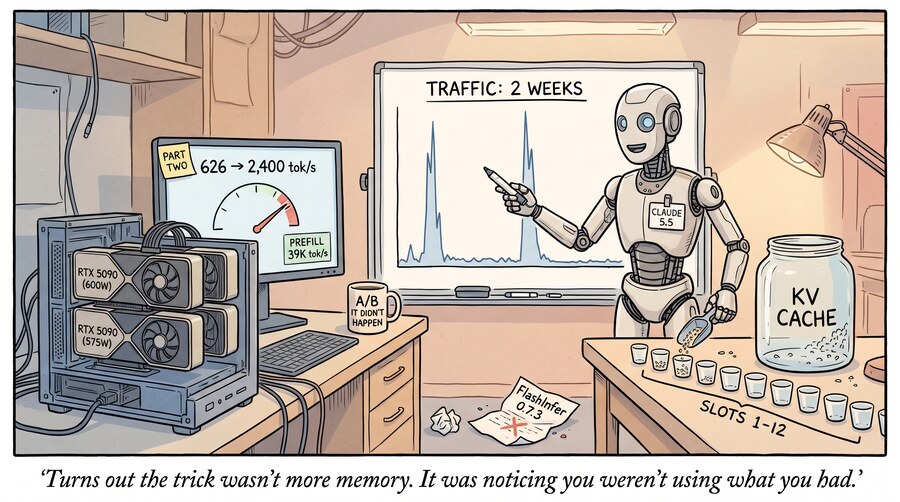
Part two of Can Claude Double the Speed of Qwen3.6-35B-A3B on an RTX 5090?
TL;DR
Two weeks ago, Elsa, our SGLang fork for Qwen3.6-35B-A3B NVFP4 on an RTX 5090, decoded 626
tok/s for one request and 1,956 across eight. Version 1.7 is now in production on both of our
5090s. It runs twelve requests at once instead of eight, decodes 2,432 tok/s across twelve
sampled requests (2,654 greedy), and reads prompts at 39.4K tok/s. That is 2.3× the
aggregate throughput vLLM gave us on the same card, with the same 256K context, vision and
tools. The biggest step came from our own traffic: two weeks of metrics showed bursts queuing
for slots while the KV cache sat mostly empty, so we gave up 14% of the KV cache for 50% more
running requests. The rest came from a smaller temporary copy in the Mamba state pool, fourteen
fixes picked from SGLang’s nightly branch, and one opt-in sampling flag worth 2.5–5%. As before,
Claude did the engineering and I decided what to keep.
Where part one left off
Part one ended with Elsa in production on two RTX 5090s: speculative decoding (MTP), a 358K-token KV pool, eight concurrent requests. Since then it has been through 1.5 (prebuilt kernels, a two-minute first boot), 1.6 (a rebase onto SGLang v0.5.23 and a 24 GB host-memory prefix cache) and now 1.7. This post is mostly about the last step. Claude got one of the two cards for an evening and then eight hours overnight, with the instruction to try everything that looked promising and keep only what survived an A/B test.
| vLLM (start) | Stock SGLang | Elsa, part one | Elsa 1.7 | |
|---|---|---|---|---|
| decode, 1 request | 267 tok/s | 310 | 626 | 681 |
| decode, 8 requests (aggregate) | 1,145 | 1,201 | 1,956 | 2,085 |
| decode, 12 requests (aggregate) | — | — | — | 2,654 |
| decode, 12 requests, sampled | — | — | — | 2,432 |
| requests that fit | 16 configured | 9 | 8 | 12 |
Decode here is greedy unless marked sampled; sampled means temperature 0.7 with the model’s default top-k of 20, which is what our chat traffic actually uses. Single-request numbers drift between 624 and 723 tok/s from one boot to the next on any build, so I don’t read much into the 626 → 681 change. The real gains are at the top of the table.
First, look at the traffic
Before tuning anything, Claude pulled two weeks of our Prometheus metrics. Our traffic is bursty: two days had 83K and 97K requests, with requests waiting in the queue about 10% of the time. Since then it has been under 500 a day. About 87% of all prompt tokens come out of the prefix cache rather than being computed.
The profile also showed what we weren’t using. During a real burst the GPU’s KV cache sat 1–17% full, while the Mamba state slots (the hybrid model’s linear-attention memory, one set per running request plus cached prefixes) were all taken. Agents mostly resume long, shared prefixes, and the 24 GB host-memory cache catches what falls out of the GPU. On a quiet day nothing we tuned would matter. On a burst day requests waited for a slot while gigabytes of KV cache stayed empty.
That settled the priority: trade KV cache we weren’t using for more running requests.
Twelve at a time
Every extra running slot is paid for out of the KV pool, so Claude swept 8, 12 and 16 against bursts shaped like our busiest day:
- 8 running: baseline. 411K KV tokens, about 900 MiB free at worst.
- 12 running: +15% burst throughput, and median time to first token fell from 1.12 to 0.72 s. The KV pool drops to 355K tokens, a 14% cut, but still holds a full 256K conversation with room to spare. 825 MiB free at worst.
- 16 running: +31% burst throughput, but 299K KV tokens and only 665 MiB free.
Without the traffic data, cutting the KV cache would have looked like a step backward; part one spent most of its effort growing it. With the data, it was the cheapest 15% available.
We have been burned before. On October 25 a 29K-token request with a maximum-size image crashed the server 144 MiB short of memory, after two hours of real traffic. So we took 12 and left 16 for a day when burst traffic comes back and the extra memory risk is worth it.
The extra slots only fit because of a fix ported from SGLang’s nightly branch that copies Mamba state in chunks rather than all at once. At our model’s size, copying eight requests’ state peaked at 240 MiB of temporary memory. Chunked, it peaks at 60 MiB and takes the same time. That fix became 1.6.2, and the 180 MiB it saves is exactly the kind of margin that makes twelve slots safe.
Fishing in the nightly branch
SGLang’s main branch moves fast. Claude went through about two weeks of it and listed what might matter for this model, then I said try them all. Fourteen commits applied cleanly or with small fixes: Qwen3.5 MTP and GDN graph work, a GDN convolution tile for verification, CUDA-graph metadata reuse, a host-cache read fix, a radix-tree lock change and a guard that skips a Mamba checkpoint instead of crashing when slots run out. That last one was hand-ported, because our allocator API differs from upstream’s. Together they added 1.7–1.8% at four and eight requests on real code-and-math prompts, and both 1.7 runs beat both 1.6.2 runs.
| Tried | Result | Kept? |
|---|---|---|
| 14 upstream fixes | +1.7–1.8% at 4 and 8 requests | Yes |
| Sparse top-k verify sampling flag | sampled decode +5.1 / +2.5 / +3.7% at 1 / 4 / 8 | Yes |
| 12 running slots | +15% burst throughput | Yes |
| FlashInfer 0.7.3 | −2.4% / −5.2% at 4 / 8 | No |
| Host cache write-back instead of write-through | agent resumes 54 → 40 of 70 | No |
| Prefill-extend CUDA graphs for GDN | −340 MiB, no burst gain | No |
| Post-verify CUDA graph | −100 MiB, no gain | No |
The flag was the surprise. With speculative decoding, every drafted token has to be checked against the model’s full probability distribution. With top-k sampling, only the top 20 tokens can ever be chosen, so the check can skip the rest. Sampled decode rose 2.5–5% at no memory cost, and every run with it beat every run without it. GSM8K accuracy with sampling stayed the same: 95.5% vs 95.2% over four runs each.
FlashInfer 0.7.3 was the disappointment. It is the newer kernel library, it installed cleanly, and it was 5% slower at eight requests. We stayed on 0.7.2. Write-back looked good on paper but writes to host memory only on eviction, so the host cache held half as much and fewer agents found their context waiting.
What the measurements taught
Three lessons, all from getting a number wrong first:
- Boot drift is bigger than most gains. Single-request greedy decode moves 15% between restarts of the same image. Every decision above came from interleaved A/B runs over at least two boots, never one run.
- Read the metric’s definition. SGLang’s speculative acceptance metric is a recent-window gauge, not a run average; identical runs read anywhere from 3.5 to 4.4.
- Benchmarks lie above the running limit. Our load generator adds up per-request speeds. With more clients than slots, waiting requests still count, and an eight-slot server “scored” 2,863 at twelve clients. The twelve-request numbers in this post are from servers with twelve slots.
Before anything shipped, both 1.7 and a 1.6.2 control ran six rounds of a mixed soak, with images, bursts, a 150K-token needle and twenty agents all at once. Each lost the same 40 MiB of headroom in the same steps. Neither crashed.
Two 5090s, again
The two cards differ: one runs at 600 W in a PCIe 5.0 x16 slot on an AMD host, the other at 575 W in a PCIe 4.0 x4 slot on an Intel host. Same 1.7 image, same benchmark:
| Elsa 1.7 | 1 | 4 | 8 | 12 requests |
|---|---|---|---|---|
| greedy decode, 600 W (AMD) | 681 | 1,414 | 2,085 | 2,654 |
| greedy decode, 575 W (Intel) | 658 | 1,363 | 2,005 | 2,590 |
| sampled decode, 600 W | 428 | 1,169 | 1,919 | 2,432 |
| sampled decode, 575 W | 414 | 1,132 | 1,878 | 2,357 |
| prefill, 600 W | 38.3K | 39.0K | 39.1K | 39.4K |
| prefill, 575 W | 29.0K | 34.7K | 35.8K | 35.7K |
Decode is 2–4% apart, about what the 25 W would predict, and inside the boot-to-boot drift. Prefill is the interesting row. Part one found the two cards within 1% on 120K- and 225K-token prompts, where the GPU is busiest and power would matter most. These are 8K-token prompts, and the gap is largest for a single request (24%) and shrinks under load (9%). That pattern points at per-request work on the host side, such as scheduling, tokenizing and moving data over the narrower link, rather than the card’s power limit. It is the next thing to chase.
Production
1.7 went to the AMD host first, then the Intel host after a spot check: tool calls, eleven vision cases, GSM8K
96.0%, a 208K-token needle and the speed runs above. Rollback is one compose file. The code is
tagged elsa-v1.7 locally. As in part one, the hours went to Claude: it read the commits, wrote and resolved the patches, ran
every A/B test, and told me when its own numbers were wrong. I picked what to try and what to
believe.
All numbers are from one RTX 5090 per row, Qwen3.6-35B-A3B NVFP4, 256K context, MTP 5/6, FlashInfer 0.7.2, driver 620.70. Sampled decode uses roughly 8K-token prompts, temperature 0.7 and top-k 20. Greedy decode uses 1,024-token completions.